The following comparison line graph indicates the number of vehicles sold for a seven week period by two different salespeople. Use the graph to answer the question.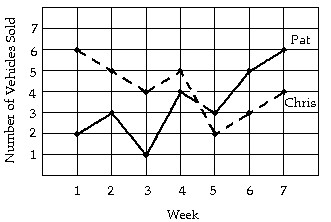 How many more vehicles did Pat sell in the seventh week than did Chris sell in the seventh week?
A. 6 vehicles
B. 2 vehicles
C. 4 vehicles
D. 3 vehicles
Answer: B
Mathematics
You might also like to view...
Decide whether the statement translates into an expression or an equation.the ratio of a number and 12
A. Expression B. Equation
Mathematics
Find the area.Leave the answer in cm2.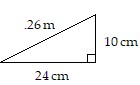
A. 60 cm2 B. 240 cm2 C. 312 cm2 D. 120 cm2
Mathematics
Perform the indicated operations.10(-1)(3)(-2)
A. 9 B. -60 C. 60 D. 16
Mathematics
Solve the problem.Fill in the blank.5 + 10
+ 10 =
= 
 is an example of the ___________ property.
A. commutative B. inverse C. associative D. distributive
Mathematics