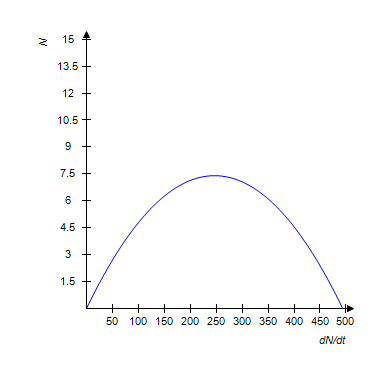
The equation of change for a certain population is
 .
.
A: Plot the graph of  versus N.B: Explain in practical terms what the graph in part A shows us.C: What are the equilibrium solutions for this equation of change?D: What is happening to the population when it reaches the value of an equilibrium solution?
What will be an ideal response?
?
?
B: It shows the growth rate of the population at a given population level.
?
C:  and
and 
?
D: The population is not changing. It is neither growing nor declining.
You might also like to view...
For a function that shows exponential decay, an increase of 1 unit in the variable causes the function to be divided by the decay factor.
Answer the following statement true (T) or false (F)
Multiply.(-3)(-7)(-10)
A. 210 B. -110 C. -220 D. -210
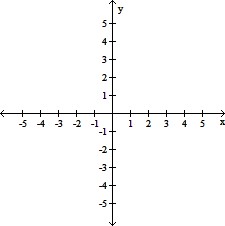
Graph the function and determine the values of x for which the function is continuous. If the function is not continuous, determine the reason.f(x) = 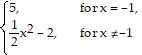
A. 
Not continuous at 
small change
B. 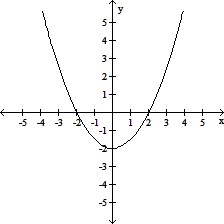
Continuous for all x
C. 
Not continuous at 
function not defined
D. 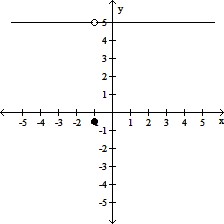
Not continuous at 
small change
Find the exact value of the square root without a calculator.
A. 11
B. 121
C. 
D. 