Refer to the diagram, assuming that the firm represented is operating on curve TC 0 . A change from TC 0 to TC 1 could be caused by:
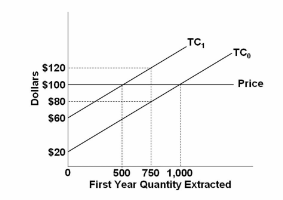
A. a decrease in extraction costs.
B. an increase in user costs.
C. an increase in the price of the resource.
D. a decrease in the price of the resource.
B. an increase in user costs.
You might also like to view...
The change in the economic welfare of a country associated with an increase in a tariff equals
A) efficiency loss - terms of trade gain. B) efficiency gain - terms of trade loss. C) efficiency loss + tax revenue gain. D) efficiency loss + tax revenue gain + terms of trade gain. E) efficiency loss - tax revenue gain.
Shifts of the ________ curves result from autonomous monetary policy
A) MP, IS, & AD B) MP & IS, but not AD C) IS & AD, but not MP D) MP, but not IS nor AD E) none of the above
A decrease in demand for a good could mean that
a. consumers are willing to pay a higher price for each quantity of the good b. consumers are willing to buy larger quantities of the good at each price c. the demand curve has undergone a parallel shift to the right d. the demand curve has undergone a nonparallel shift to the right e. the demand curve has shifted to the left
In a market for emission permits, firms that emit over their allowed limits
A. must buy more allowances through a trading system. B. are forced to shut down. C. are taxed by the government for the amount of emissions. D. will sell their excess allowances through a trading system.