Use a graphing calculator to plot the data and find the quadratic function of best fit.The number of housing starts in one beachside community remained fairly level until 1992 and then began to increase. The following data shows the number of housing starts since 1992 (x = 1). Use a graphing calculator to plot a scatter diagram. What is the quadratic function of best fit?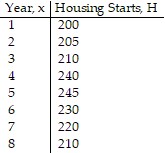
A. H(x) = -2.679x2 - 26.607x + 168.571
B. H(x) = -2.679x2 + 26.607x + 168.571
C. H(x) = -2.679x2 + 26.607x - 168.571
D. H(x) = 2.679x2 + 26.607x + 168.571
Answer: B
Mathematics
You might also like to view...
Express the number in scientific notation.0.0000004
A. 4 × 10⁻⁶ B. 4 × 10⁻⁸ C. 4 × 10⁻⁷ D. 4 × 10⁻⁹
Mathematics
Solve for the variable.x - 17 = -12
A. -29 B. -5 C. --29 D. 5
Mathematics
Evaluate the expression.P(6, 0)
A. 1440 B. 720 C. 1 D. 0.5
Mathematics
Find the value of the variable that satisfies the equation.10x + 1 = 4 + 3x
A. x = 
B. x = 
C. x = 
D. x = - 
Mathematics