Figure 3-15
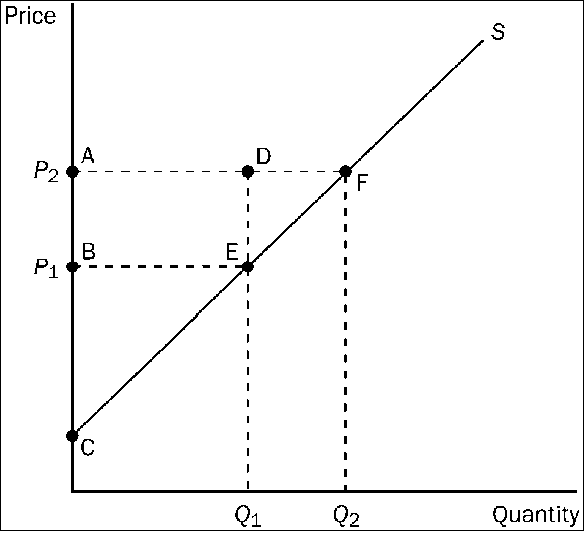
Refer to . Which area represents the increase in producer surplus when the price rises from P1 to P2?
a.
BCE
b.
ACF
c.
ABED
d.
AFEB
d
You might also like to view...
The figure above shows the relationship between the price of a dozen roses and the quantity of roses a florist can sell. The slope between points A and B is
A) 20. B) 16. C) 2. D) 4. E) nonexistent because at point A, no roses are sold.
As of 2013, how large is the debt of developing countries to the rest of the world?
A) $350 million B) $350 billion C) $7 trillion D) $35 trillion E) $3.5 trillion
If government decides to produce a collective consumption good, taxes have to be levied to finance the production. In evaluating government provision then, the benefits of public production have to be _____
a. high b. weighed against the excess burden of taxation c. positive d. weighted against the tax incidence on poor families
According to the theory of utility maximization,
a. people who buy tap water apparently feel the additional benefit (compared with bottled water) offsets the additional cost b. people who buy bottled water apparently feel the additional benefit (compared with tap water) offsets the additional cost c. the marginal utility of the last gallon of bottled water consumed exceeds the marginal utility of the first gallon of tap water consumed d. the marginal utility of bottled water exceeds the marginal utility of diamonds e. bottled water must be more expensive (per gallon) than tap water