Solve the problem.The graph shows the hours studied and the exam grades obtained on a finite math exam for 8 students. (The two points on the line do not represent any of the eight students.) The line of best fit, the line graphed on the coordinate system, can be used to approximate the test grade the average student receives for the number of hours they study.  Find the equation of the line of best fit.
A. G =  x - 50
B. G =  x + 8
x + 8
C. G =  x + 50
D. G =  x + 50
Answer: D
Mathematics
You might also like to view...
Use power series operations to find the Taylor series at x = 0 for the given function.x4 sin x
A. 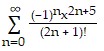
B. 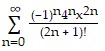
C. 
D. 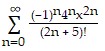
Mathematics
Perform the operation and reduce the answer to lowest terms.8 + 10
+ 10
A. 9
B. 89
C. 18
D. 1
Mathematics
Graph the function.F(x) = 

A. 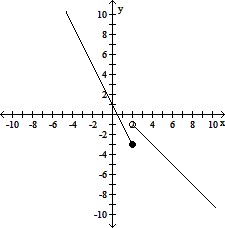
B. 
C. 
D. 
Mathematics
Multiply.4a ? 2a2
A. 8a4 B. 8a3 C. 6a3 D. 4a + 2a2
Mathematics