Evaluate the expression.P(8, 0)
A. 1
B. 80,640
C. 40,320
D. 0.5
Answer: A
You might also like to view...
Use the bar graph, which shows the receipts of the federal government (in billions of dollars) for selected years from 1996 through 2006. In this exercise you are given the expenditures of the federal government. Find the magnitude of the surplus or deficit for the year 2006.
(Source: U.S. Office of Management and Budget)
?
 Year
Receipts
Expenditures
|Receipts - Expenditures|
?2006
?
?2655.4
?
?
Year
Receipts
Expenditures
|Receipts - Expenditures|
?2006
?
?2655.4
?
?
A. ?
| Year | Receipts | Expenditures | |Receipts - Expenditures| |
| ?2006 | ?2407.3 | ?2655.4 | ?248.1 |
B. ?
| Year | Receipts | Expenditures | |Receipts - Expenditures| |
| ?2006 | ?2407.3 | ?2655.4 | ?102.4 |
C. ?
| Year | Receipts | Expenditures | |Receipts - Expenditures| |
| ?2006 | ?2407.3 | ?2655.4 | ?105.4 |
D. ?
| Year | Receipts | Expenditures | |Receipts - Expenditures| |
| ?2006 | ?2407.3 | ?2655.4 | ?107.4 |
E. ?
| Year | Receipts | Expenditures | |Receipts - Expenditures| |
| ?2006 | ?2407.3 | ?2655.4 | ?107 |
Find the derivative of y with respect to the independent variable.y = (cos ?)
A. - cos ? sin ?
B. - (cos ?)
 -1 sin ?
C.  (cos ?)
 -1
-1
D. -(cos ?) -1 sin ?
Determine whether the graph is the graph of a function.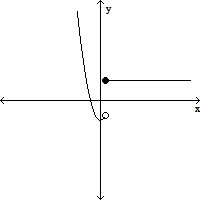
A. Function B. Not a function
Use the circle graph to solve the problem.A survey of the 5087 vehicles on the campus of State University yielded the following circle graph.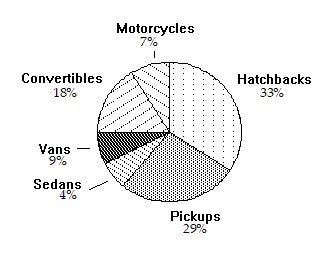 Together, what percent of the vehicles are either vans or convertibles?
A. 162% B. 27% C. 9% D. 18%