Create a graphical display for the data given. You may choose any graphic type that you feel is appropriate. Write a few sentences explaining why you chose this type of display and a few sentences describing any interesting patterns in the data.The table below shows the number of AIDS diagnoses for the United Kingdom by year. 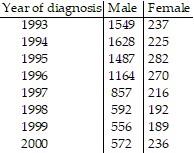
What will be an ideal response?
Answers will vary. One possible answer: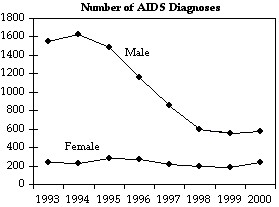
The line graphs show the trend over time. There has been a dramatic decline in male diagnoses, while female cases have remained relatively steady over time.
You might also like to view...
As summer approaches the size of Matt's wardrobe increases weekly by 6%. Assume that Matt's wardrobe contained 112 pieces in March, and let GN denote the number of pieces in his wardrobe N months after March.Give an explicit formula for GN.
A. GN = N ? (1.06)112 B. GN = N ? (112)1.6 C. GN = 112 ? (1.6)N D. GN = 112 ? (N)1.06 E. GN = 112 ? (1.06)N
Solve the equation.2 +  =
= 
A. 
B. 
C. 
D. 
Solve. Assume the exercise describes a linear relationship. When writing a linear equation, write the equation in slope-intercept form.The total sales made by a salesperson was $25,000 after 3 months and $68,000 after 23 months. Predict the total sales after 48 months.
A. $121,720 B. $121,792 C. $121,750 D. $121,850
Evaluate the expression. Write your answer without exponents.
A. 6 B. 36 C. 12 D. 216