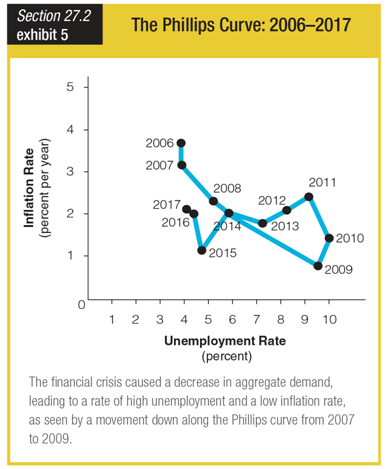
In the graph showing the Phillips curve from 2006 to 2016, we can see that during the period following the 2008 financial crisis, the Phillips curve ______.
a. shifted considerably to the left
b. shifted considerably to the right
c. fluctuated wildly
d. remained fairly stable
d. remained fairly stable
You might also like to view...
As a result of increased use of credit cards,
A) the demand for money has decreased and there has been a movement up along the demand for money curve. B) the demand for money has decreased and there has been a movement down along the demand for money curve. C) the equilibrium nominal interest rate has decreased and bond prices have fallen. D) the demand for money has decreased and the demand for money curve has shifted leftward. E) the equilibrium nominal interest rate has increased and bond prices have decreased.
Which of the following statements is FALSE?
A) Economic goods are available in desired quantities at a zero price. B) A good is anything that gives satisfaction or happiness to individuals. C) Services are intangible goods such as dry cleaning, hospital care, and restaurant meal preparation. D) Wants are unlimited and include all material and nonmaterial desires.
Which of the following would be subtracted from the GDP to determine the GNP?
a. the profits a Chinese company earns in China b. the profits a U.S. company earns in the United States c. the profits a U.S. company earns in China d. the profits a Chinese company earns in the United States
Suppose that real domestic output in an economy is 300 units, the quantity of inputs is 50, and the price of each input is $9. The per-unit cost of production is:
A. $0.67. B. $55.00. C. $33.33. D. $1.50.