Refer to the graph below for a monopoly. Assuming this were a perfectly competitive market, then the price and quality would be shown at the point of intersection between the
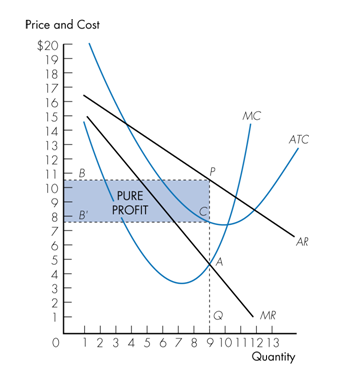
a. MC and AR curves.
b. MC and MR curves.
c. ATC and AR curves.
d. MC and ATC curves.
a. MC and AR curves.
You might also like to view...
The quantity supplied of corn is the number of bushels that corn farmers want to sell under the current market conditions, while the supply of corn is a set of price-quantity pairs showing the amounts that farmers wish to sell at various hypothetical prices. According to the law of supply, a rise in the price of corn will cause a rise in the quantity supplied of corn. Non-price factors that positively affect corn growers (such as improved weather conditions, better agricultural technology, and lower costs of fertilizer, seed, labor, and other inputs) would cause a rise in the supply of corn. A rise in quantity supplied is shown by moving up and to the right along the supply curve, and a rise in supply is shown by shifting the supply curve down and to the right.
What will be an ideal response?
Which of the following is not a source of funding available to? governments?
A. Taxes. B. Stock sales. C. User charges. D. Borrowing.
Which of the following statements is true?
A. All people in poverty are on welfare. B. Unemployment compensation is an example of an in-kind transfer. C. Temporary Assistance to Needy Families (TANF) is an example of a cash payment made by government to the impoverished. D. After cash assistance and in-kind transfers are considered the distribution of income in the United States is more unequal.
When real GDP is in equilibrium there will be no tendency
A. to save. B. for real GDP to increase or decrease. C. to invest. D. to import.