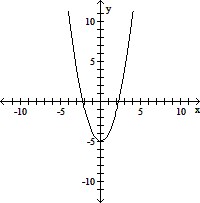
Graph. -
-  = 1
= 1
A. 
B. 
C. 
D. 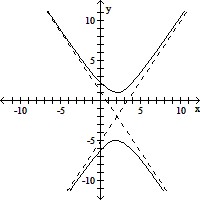
Answer: A
You might also like to view...
Find the average value of the function over the given interval.y = 2 - x2; [-5, 4]
A. 
B. 
C. - 
D. - 5
Solve the problem. Round to the nearest tenth, if necessaryWhat is the part, if the percent is 100 and the whole is 1980?
A. 198 B. 1980 C. 19,800 D. 198,000
Solve the problem.A lake is stocked with 545 fish of a new variety. The size of the lake, the availability of food, and the number of other fish restrict growth in the lake to a limiting value of 3406. The population of fish in the lake after time t, in months, is given by the function P(t) =  . After how many months will the population be 2405?
A. 7 mo B. 10 mo C. 12 mo D. 17 mo
Graph the function by starting with the graph of the basic function and then using the techniques of shifting, compressing, stretching, and/or reflecting.f(x) = (x + 5)2 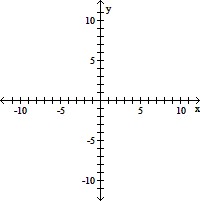
A. 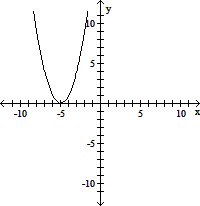
B. 
C. 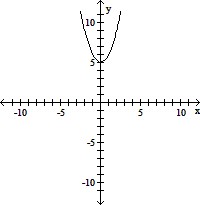
D.