Create a graphical display for the data given. You may choose any graphic type that you feel is appropriate. Write a few sentences explaining why you chose this type of display and a few sentences describing any interesting patterns in the data.The table below shows the population of the United States in 2000 broken down by age and gender. Population is given in millions. 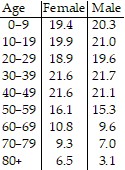
What will be an ideal response?
Answers will vary. One possible answer: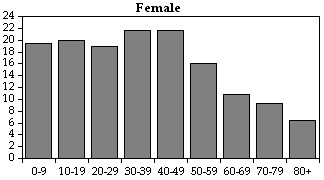
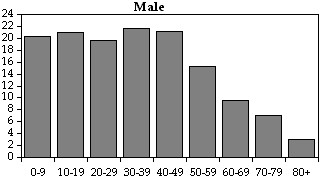
Two separate bar graphs work to show the individual distributions more clearly.
Mathematics
You might also like to view...
Find the median.4, 4, 18, 27, 33, 39, 49
A. 33 B. 27 C. 25 D. 18
Mathematics
Find the solution set of the linear system. Identify inconsistent systems and dependent equations. For dependent equations, write your answer as an ordered triple in terms of z.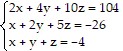
A. {(-4, 5, -3)} B. {(2z - 1, z + 2, z)} C. {(5, -3, -4)} D. inconsistent
Mathematics
Solve the equation.42 -  =
= 
A. 
B. 
C. {135}
D. {3}
Mathematics
Perform the division.![]()
A. ![]()
B. ![]()
C. ![]()
D. ![]()
E. ![]()
Mathematics