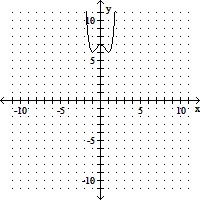
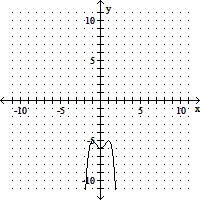
Sketch the graph and show all local extrema and inflection points.y = -x4 + 2x2 - 7
A. Absolute maxima: (-1, -6), (1, -6)
Local minimum: (0, -7)
No inflection points
B. Absolute minima: (-1, 6), (1, 6)
Local maximum: (0, 7)
Inflection point:  ,
, 
C. Absolute maxima: (-1, -6), (1, -6)
Inflection points:  ,
, 
D. Absolute maxima: (-1, -6), (1, -6)
Local minimum: (0, -7)
Inflection points:  ,
, 
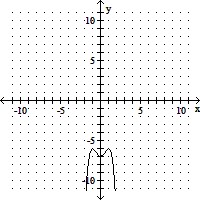
Answer: D
You might also like to view...
Match to the equivalent expression. ?
? 
A. 
B. 
C. 
D. 
Thanks to smaller and more fuel-efficient models, American carmakers have doubled their average fuel economy over a 13-year period, from 1974 to 1987. The graph depicted in the figure gives the average fuel consumption in miles per gallon (mpg) of domestic-built cars over the period under consideration ( corresponds to the beginning of 1974). Use the trapezoidal rule to estimate the average fuel consumption of the domestic car built during this period. Round the result to the nearest hundredth.
?
(Hint: Approximate the integral  .)
.)
?

?
A. 20.68 mpg
B. 21.71 mpg
C. 19.26 mpg
D. 21.27 mpg
Evaluate the determinant.
A. 0 B. 2ab C. a2 - b2 D. a2 + b2
Evaluate.3431/3
A. 21 B. 7 C. 7203 D. 2401