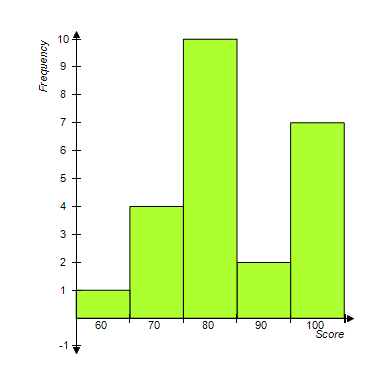
Which frequency table best describes the data displayed in the frequency histogram?
?
?
A. ?
| Score | Frequency |
| 30 | 2 |
| 35 | 8 |
| 40 | 20 |
| 45 | 4 |
| 50 | 14 |
B. ?
| Score | Frequency |
| 1 | 60 |
| 4 | 70 |
| 10 | 80 |
| 2 | 90 |
| 7 | 100 |
C. ?
| Score | Frequency |
| 60 | 1 |
| 70 | 4 |
| 80 | 10 |
| 90 | 2 |
| 100 | 7 |
D. ?
| Score | Frequency |
| 30 | 1 |
| 35 | 4 |
| 40 | 10 |
| 45 | 2 |
| 50 | 7 |
E. ?
| Score | Frequency |
| 60 | 2 |
| 70 | 8 |
| 80 | 20 |
| 90 | 4 |
| 100 |
Answer: C
Mathematics
You might also like to view...
Provide an appropriate response.In a formula r varies jointly as s and t. if r = 540 when s = 15 and t = 24, find r when s = 21 and t = 30.
A. 771 B. 22.5 C. 945 D. 9,540
Mathematics
Find the intersection of the sets.{a, e, o, u} ? ?
A. {a} B. ? C. {a, e, o, u} D. {u}
Mathematics
Evaluate the expression.
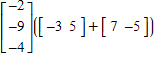 ?
?
A. 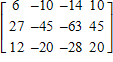
B. 
C. 
D. not possible
E.

Mathematics
Suppose that x and y are related by the equation x3 + (2y + 1)2 = y2. Use implicit differentiation to determine  .
.
A.  =
= 
B.  = 3x2 + 2(y + 1)
C.  =
= 
D.  =
= 
Mathematics