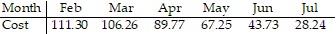
Solve the problem.The data below represent the average monthly cost of natural gas in an Oregon home. 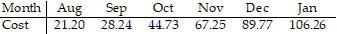
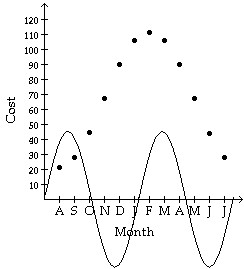 Above is the graph of 45.05 sin x superimposed over a scatter diagram of the data. Find the sinusoidal function of the form
 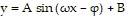 which best fits the data.
A. y = 45.05 sin  + 21.20
B. y = 45.05 sin  + 21.20
C. y = 45.05 sin  + 66.25
D. y = 45.05 sin  + 66.25
Answer: D
Mathematics
You might also like to view...
Decide whether the pair of lines is parallel, perpendicular, or neither.3x - 2y = -162x + 3y = -20
A. parallel B. perpendicular C. neither
Mathematics
Evaluate the square root. If the answer is not a real number, state so.
A. -3 B. 0.6 C. 6 D. 3
Mathematics
Fill in the blank with the correct inequality symbol.If x < 7, then -4x  -28.
-28.
A. ? B. > C. < D. ?
Mathematics
Use the pictograph to answer the question.The pictograph illustrates the number of miles driven each day for one week. Each car represents 15 miles. How many miles were driven on Wednesday?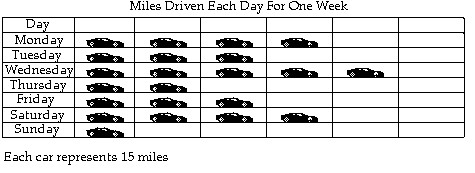
A. 30 miles B. 60 miles C. 90 miles D. 75 miles
Mathematics