Of the collection of supply and demand diagrams in Figure 2.2, which one(s) could show the result of an increase in income?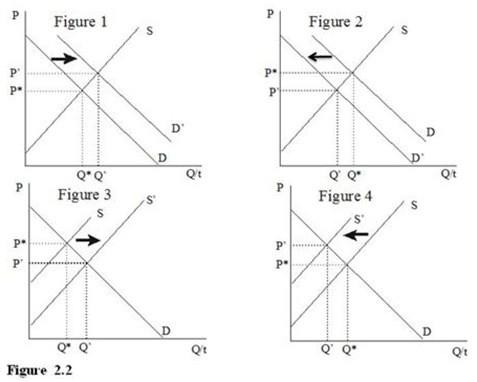
A. Figure 1
B. Figure 2
C. Figure 3
D. Figures 1 and 2
Answer: D
You might also like to view...
Giving poor people food instead of cash for food
A. is an in-kind transfer. B. will benefit some more than others, depending on their utility function. C. is politically popular. D. all of these answer options are correct.
According to the text, government spending accounts for about ________ percent of all U.S. health care expenditures
A) 70 B) 10 C) 30 D) 40
The use of government to supplant market outcomes is called
A) market failure. B) rent seeking. C) free riding. D) efficiency.
In a free-market economy, the pricing mechanism always operates to
A. produce an equitable distribution of income. B. provide an efficient allocation of resources. C. correct any inequality in distribution of output. D. equate consumers’ desires with ability to pay.