Analyze the graph of the given function f as follows:(a) Determine the end behavior: find the power function that the graph of f resembles for large values of |x|.(b) Graph f using a graphing utility.(c) Find the x- and y-intercepts of the graph.(d) Use the graph to determine the local maxima and local minima, if any exist. Round turning points to two decimal places.(e) Use the information obtained in (a) - (d) to draw a complete graph of f by hand. Label all intercepts and turning points.(f) Find the domain of f. Use the graph to find the range of f.(g) Use the graph to determine where f is increasing and where f is decreasing.f(x) = x4 - 1.8x2 + 0.5184
What will be an ideal response?
(a) For large values of |x|, the graph of f(x) will resemble the graph of y = x4.
(c) y-intercept: (0, 0.5184), x-intercepts: (-1.2, 0), (-0.6, 0), (0.6, 0), and (1.2, 0)
(d) Local maximum at (0, 0.5184); Local minima at (-0.95, -0.29) and (0.95, -0.29)
(e) 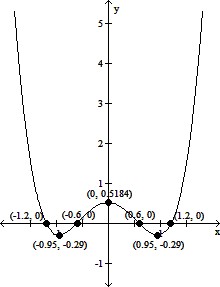
(f) domain of f: all real numbers; range of f: 
(g) f is increasing on (-0.95, 0) and (0.95, ?); f is decreasing on (-?, -0.95) and (0, 0.95)
You might also like to view...
Find numbers a and b, or k, so that f is continuous at every point.


A. k = 49
B. k = 7
C. k = 
D. Impossible
Provide an appropriate response.How many significant digits are there in 6,600?
Fill in the blank(s) with the appropriate word(s).
Graph y = f(x). Compare the graph to the graph of y = log x.f(x) = -3 log x
A. Reflected across the x-axis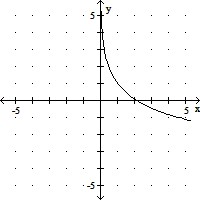
B. Reflected across the x-axis and
changes faster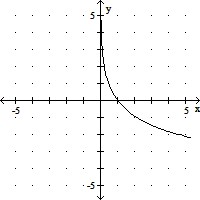
C. Increases faster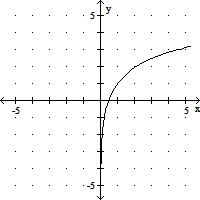
D. Increases faster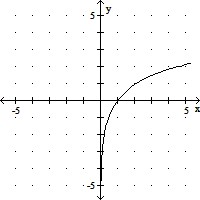
Evaluate. ÷ (-8)
A. - 
B. 
C. - 
D. -24