Use a graphing calculator to plot the data and find the quadratic function of best fit.The following table shows the median number of hours of leisure time that Americans had each week in various years. Use x = 0 to represent the year 1973. Using a graphing utility, determine the quadratic regression equation for the data given. What year corresponds to the time when Americans had the least time to spend on leisure?
What will be an ideal response?
M(x) = 0.04x2 - 1.21x + 26.03; 1988
You might also like to view...
Solve the problem.The monthly incomes of trainees at a local factory are normally distributed with a mean of $1600 and a standard deviation $150. What percentage of trainees earn less than $1390 a month?
A. 1.40% B. 44.04% C. 91.92% D. 8.08%
Evaluate  figures 4.png) f(x, y, z)dV where f(x, y, z) = 7y and T is the region bounded by the paraboloid y = x² + z² and the plane y = 1.
f(x, y, z)dV where f(x, y, z) = 7y and T is the region bounded by the paraboloid y = x² + z² and the plane y = 1.
What will be an ideal response?
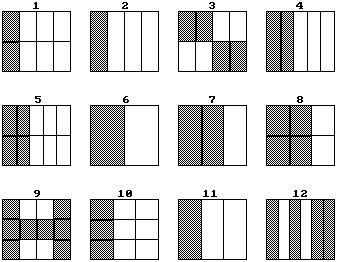
Use the figures to answer the question. Are there five figures of equivalent fractions shown?
A. Yes B. No
Find fractional notation for the ratio. You need not simplify.At an advertising agency that employs 207 people, 91 employees receive 3 weeks of paid vacation each year. What is the ratio of those who receive 3 weeks of paid vacation to the total number of employees?
A. 
B. 
C. 
D. 