Solve the problem.The one-day temperatures for 12 world cities along with their latitudes are shown in the table below. Make a scatter diagram for the data. Then find the line of best fit and graph it on the scatter diagram.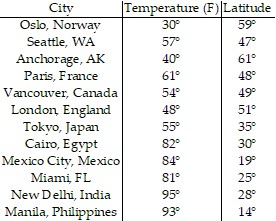 Latitude (degrees)
 Temperature (F)°
What will be an ideal response?
Latitude (degrees)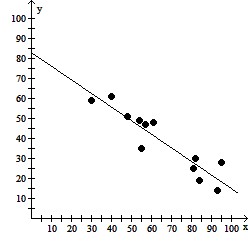
Temperature (F)°
Line of best fit = -0.68x + 82.91
Mathematics
You might also like to view...
Multiply.(4.5x5)(4x6)
A. 18x11 B. 1.8x11 C. 18x30 D. 180x30
Mathematics
Find the least common denominator. and
and 
A. (x + 4)(x + 2) B. (x + 2)(x - 6) C. (x + 4)(x + 2)(x - 6) D. (x - 4)(x - 2)(x - 6)
Mathematics
Simplify. Assume that all variables represent positive real numbers.
A. 
B. 
C. 
D. 
Mathematics
Convert the measure to its alternate U.S. or metric form. Write improper fractions as mixed numbers for U.S. measures and as decimals for metric measures.Convert 56 kilometers to miles.
A. 28 miles
B. 22 miles
miles
C. 35 miles
D. 17 miles
miles
Mathematics