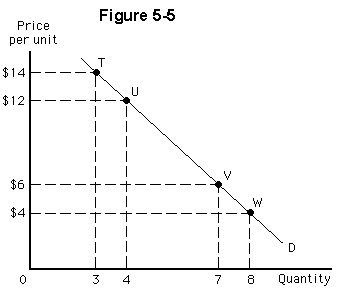
In Figure 5-5, the slope of the demand curve
a.
has a constant value of -2
b.
is higher between points T and U than between points V and W
c.
is lower between points T and U than between points V and W
d.
matches the value of the price elasticity of demand at each point
e.
is lower than the value of the price elasticity of demand at every point
a
You might also like to view...
Explain what market signaling is?
What will be an ideal response?
All of the following took place during the economic crisis that began in 2007 EXCEPT:
A) the financial system was disrupted B) large portions of the U.S. economy were cut off from the funds they needed to thrive C) there was a devastating decline in the production of goods and services throughout the economy D) unlike households, most businesses still had easy access to funds
Which is a screen against adverse selection
a. Insurance companies require homeowners to have smoke detectors b. Rearview cameras in cars c. Installing engine monitors to track driving habits of the insured d. Prospective secretaries must take a typing test before being hired
Exhibit 1A-3 Straight line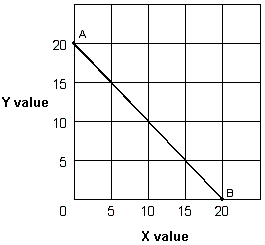 Straight line AB in Exhibit 1A-3 is a downward sloping line illustrating:
A. a direct relationship between X and Y. B. an inverse relationship between X and Y. C. X and Y are unrelated variables. D. the ceteris paribus assumption.