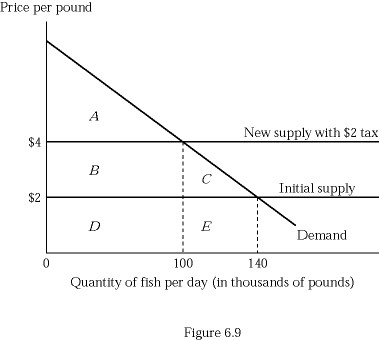
 Figure 6.9 depicts a hypothetical fish market with a horizontal supply curve. The consumer surplus at the initial equilibrium is shown by:
A. Triangle A.
B. Triangle A + Rectangle B.
C. Triangle A + Rectangle B + Triangle C.
D. Triangle A + Rectangle B + Rectangle D.
Answer: C
You might also like to view...
According to the text, the Fed and other policy makers are concerned about:
A. inflation rates that are too high only. B. inflation rates that are either too high or too low compared to its set target. C. inflations rates that are too low only. D. annual inflations rates that exceed 10%.
Suppose researchers discover that a government program to match job seekers and employers has caused an increase in the unemployment rate. Does this mean that the program has failed?
What will be an ideal response?
When the risk factor associated with a stock increases, the expected rate of return increases.
Answer the following statement true (T) or false (F)
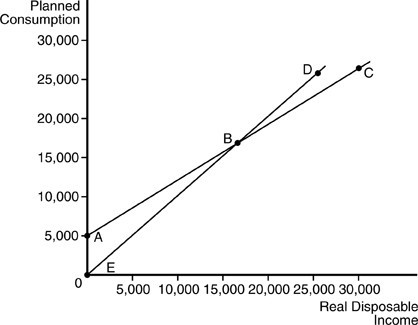 Refer to the above figure. Line ABC is called
A. the saving function. B. aggregate supply. C. the consumption function. D. the 45-degree line.