Figure 18-1
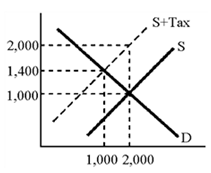
According to the graph in Figure 18-1, the increase in the amount that consumers pay as a result of the tax is
A. 1,000.00
B. 600
C. 400
D. indeterminate.
Answer: C
You might also like to view...
When production efficiency does NOT occur,
i. an economy is producing at a point within its PPF. ii. there are unemployed resources. iii. allocative efficiency cannot occur. A) i only B) i and ii C) iii only D) i and iii E) i, ii, and iii
A network externality refers to a situation where:
A) the value of a product increases as more consumers start to use it. B) firms collude to sell products at a price higher than the equilibrium market price. C) a firm that has control over key resources auctions the resources off to other firms. D) the government interferes to prevent the concentration of market power in the hands of a few firms.
U.S. securities firms recently agreed to pay a record amount of $1.4 billion in settlement charges brought by government regulators. Regulators claimed that firms had abused investors during the market boom of the 1990s
Abuses included analysts tailoring their research reports and ratings on the stocks they covered in order to win more business for their firm. If this settlement causes Wall Street firms to comply with the letter of the law but they violate the spirit of the law, the firms are engaging in A) elimination of conflicts of interest. B) creative response. C) the capture hypothesis. D) deregulation.
If the quantity demanded at a price of $10 is 2,000 and the quantity demanded at a price of $8 is 2,400, a price-discriminating monopolist would want to:
A. sell 2,000 units for $10 each and then sell an additional 400 units for $8 each. B. charge all consumers the higher price of $10 and sell 2,000 units. C. charge all consumers $8 in order to increase quantity sold to 2,400. D. sell 2,000 units for $8 each and then sell an additional 400 units for $10 each.