You would use a ______ to illustrate the data in this frequency distribution table because the variable is measured at the ______ level of measurement
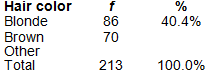
a. frequency polygon; ordinal
b. bar chart; nominal
c. histogram; interval
d. pie graph; ratio
b. bar chart; nominal
You might also like to view...
Discuss one of the four strategies for culturally responsive instruction and share how you might use literature effectively while employing this strategy.
What will be an ideal response?
Reader-response theory suggests that
a. meaning is determined by the writer b. meaning is determined by the reader c. reading is a transaction between the reader and the writer d. the reader comes to the text empty, hoping to be filled
A researcher measures the extent to which time spent watching educational preschool television programming predicts success in school. Which factor is the criterion variable in this example?
A. educational preschool television B. type of television programming C. success in school D. time spent in school
low-incidence disabilities
What will be an ideal response?