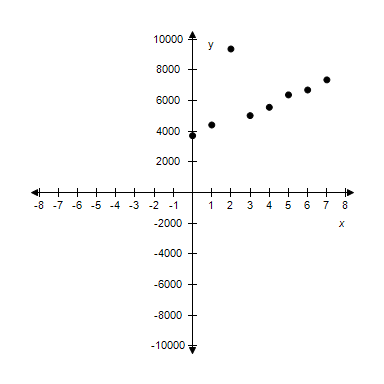
Sketch a scatter plot of the data shown in the table.The table shows the number y of Wal-Mart stores for each year x from 2000 through 2007.
Year, x
Number of stores, y
2000
3700
2001
4400
2002
4680
2003
5010
2004
5550
2005
6360
2006
6680
2007
7340
A. ?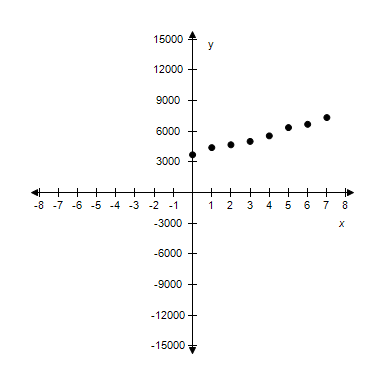
x: Year (0 ? 2000)
y: Number of stores
B. ?
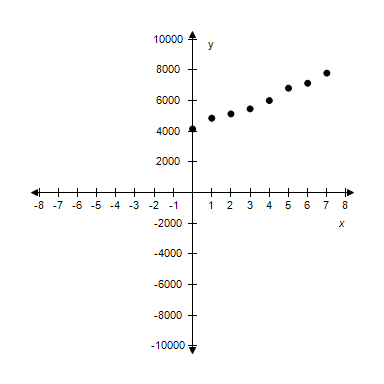
x: Year (0 ? 2000)
y: Number of stores
C. ?
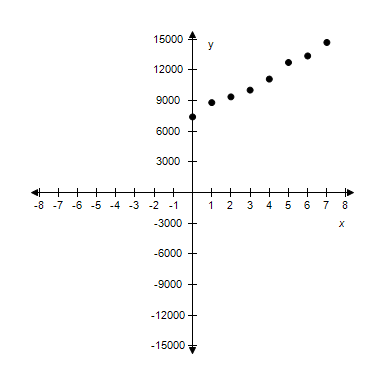
?
x: Year (0 ? 2000)
y: Number of stores
D. ?
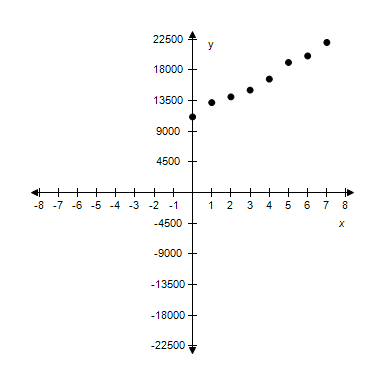
x: Year (0 ? 2000)
y: Number of stores
E. ?
x: Year (0 ? 2000)
y: Number of stores
Answer: A
Mathematics
You might also like to view...
Write true or false for the following statement.Let A = {3, 5, 7, 9, 11, 13} B = {3, 5, 9, 11} C = {5, 9, 13}5 ? C
A. True B. False
Mathematics
Answer the question or solve the problem.If b < 0, is it true that b2 > b? Explain.
What will be an ideal response?
Mathematics
Verify the identity.csc  = sec x
What will be an ideal response?
Mathematics
Complete the factoring.-16z5 = -8z2( )
A. 128z B. 2z3 C. -2z3 D. 2z2
Mathematics