Assume the market shares of the six largest firms in an industry are 12 percent each. Calculate the six-firm concentration ratio and Herfindahl-Hirschman index for this industry
What does each of these measures have to say about the degree of concentration in the industry? Explain.
The six-firm concentration ratio for the industry is 72 percent. This suggests a relatively highly concentrated industry because six firms control almost three fourths of the market. The HHI = 864. This number suggests a relatively unconcentrated industry, at least according to the guidelines used by the Department of Justice. Note that when a merger results in an HHI of less than 1,000 the Justice Department will rarely challenge the merger, strongly suggesting that the Department considers an HHI of less than 1000 to reflect a low level of market concentration.
You might also like to view...
Use the following cost table to answer the next question.OutputAverage Variable CostAverage Total CostMarginal Cost0---2$2.50$27.50$2.542.0014.501.562.0010.332.082.138.382.5102.307.303.0122.506.673.5143.006.576.0164.007.1311.0The table shows cost data for a perfectly competitive firm. If the market price for the firm's product is $6, what output level will the firm produce to maximize profits?
A. 16 B. 12 C. 0 D. 14
Assume a portfolio in which there is equal investment in two assets that are perfectly positively correlated, with equally expected returns of 10 percent and 6 percent for asset A and 8 percent and 4 percent for asset B
The expected yield on this portfolio is A) 8 percent. B) 7 percent. C) 6 percent. D) 5 percent.
Assume the graph shown represents Grace's budget constraint. Which of the following is true?
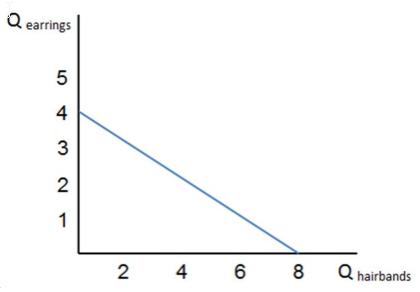
A. Grace's total utility is constant along her budget constraint.
B. Grace's marginal utility of each good is the same for each combination of goods on her budget line.
C. Grace's total expenditure is constant along her budget constraint.
D. Grace is indifferent between consuming any bundle that lies on the budget constraint.
The third step of the four step process is to
a. identify the new equilibrium and then compare the original equilibrium price and quantity to the new equilibrium price and quantity. b. decide whether the economic change being analyzed affects demand or supply. c. draw a demand and supply model before the economic change took place. d. decide whether the effect on demand or supply causes the curve to shift to the right or to the left, and sketch the new demand or supply curve on the diagram.