Refer to Figure 35-1. What is measured along the horizontal axis of the left-hand graph?
A) the wage rate
B) the inflation rate
C) employment
D) output
Answer: D) output
You might also like to view...
Most economists support open trade because it increase our choices as consumers, lowers costs for producers, increases competition and innovation, and leads to greater diffusion of technological change
Indicate whether the statement is true or false
If what producers intend to produce for consumption is precisely what consumers intend to consume, then the economy will be in equilibrium
Indicate whether the statement is true or false
Refer to the graph shown. Within which section(s) of the production function is marginal product decreasing?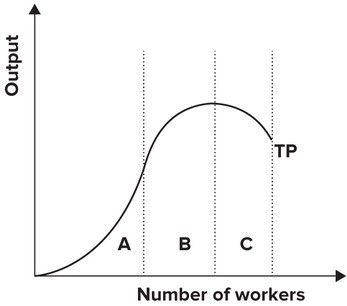
A. A B. B C. A and B D. B and C
Suppose that in a month the price of a gallon of milk increases from $2 to $2.50. At the same time, the quantity of gallons of milk demanded decreases from 100 to 80. The price elasticity of demand for gallons of milk (calculated using the midpoint formula) is approximately:
A. 0.11. B. 0.2. C. 1. D. 1.2.