The above figure shows the production possibility frontier for a country. Suppose the country is producing at point A. What would be the opportunity cost to increase the production of rice to 12 tons?
A) 6 thousand bottles of wine
B) 15 thousand bottles of wine
C) 9 thousand bottles of wine
D) 6 tons of rice
E) Nothing, it is a free lunch.
E
You might also like to view...
Explain whether the statement, "There is life on Mars," is a normative or positive statement
What will be an ideal response?
Which of the following is a difference between panel and pooled cross-sectional data?
A. A panel data set consists of data on different cross-sectional units over a given period of time while a pooled data set consists of data on the same cross-sectional units over a given period of time. B. A panel data set consists of data on the same cross-sectional units over a given period of time while a pooled data set consists of data on different cross-sectional units over a given period of time C. A panel data consists of data on a single variable measured at a given point in time while a pooled data set consists of data on the same cross-sectional units over a given period of time. D. A panel data set consists of data on a single variable measured at a given point in time while a pooled data set consists of data on more than one variable at a given point in time.
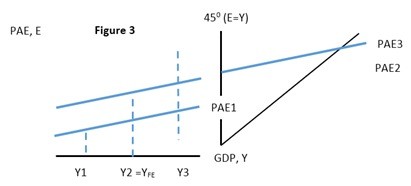 Using Figure 3 above the distance between what 2 lines illustrate an inflationary output gap?
A. Y2 to Y3 B. Y1 to Y2 C. PAE1 to PAE2 D. PAE2 to PAE3
Explain the five problems, criticisms, or complications that arise in the implementation of fiscal policy.
What will be an ideal response?