The graph of a function is given. Determine whether the function is increasing, decreasing, or constant on the given interval.(-6, -2.5) 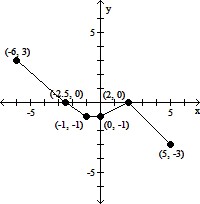
A. increasing
B. decreasing
C. constant
Answer: B
You might also like to view...
Suppose 100 people counted the number of cars passing an intersection in one hour. Due to error, not all people get the same value. The mean is 75 and the standard deviation is 1. Use the sketch to find how many people report the following. 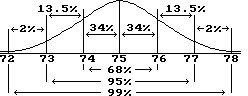 More than 74 cars
A. 16 people B. 34 people C. 50 people D. 84 people
Find the quotient.
A. 0 B. 2 C. 1 D. undefined
Solve the problem.The following table shows the median number of hours of leisure time per week for Americans in various years.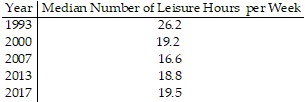 Let f(t) be the median number of hours of leisure time at t years since 1993. The data can be modeled by the quadratic model
 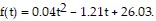 Use the model to estimate the year when the median number of hours of leisure time was the smallest.
A. 2009 B. 2008 C. 2007 D. 2006
Find the perimeter of the given square or rectangle.A square with side 5.9 in.
A. 23.6 in. B. 33.6 in. C. 11.8 in. D. 69.62 in.