Estimate the value of the quantity.The graph below shows the rate of change of the price of a stock (in dollars per share per week) over a period of 6 weeks. Estimate the total change in dollars per share of the stock during this period. Use rectangles with widths of 1 week and let the function value at the midpoint of the rectangle give the height of the rectangle.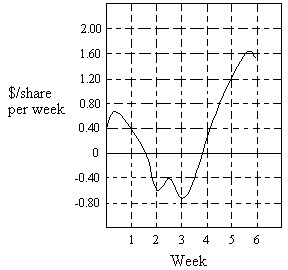
A. $2.20/share
B. $2.00/share
C. $1.60/share
D. $0.90/share
Answer: A
Mathematics
You might also like to view...
The lengths of the legs of a right triangle are given. Find the hypotenuse.a = 24, b = 7
A. 625 B. 20 C. 25 D. 5
Mathematics
Solve the equation for  .
?
.
?

What will be an ideal response?
Mathematics
Find the probability of the event.Give the probability that the roll of a die will show 5 or 6.
A. 
B. 
C. 2
D. 1
Mathematics
Subtract.
A. 64,277 B. 64,257 C. 68,283 D. 64,283
Mathematics