Solve the problem.Suppose that the speed of a car, measured in miles per hour (mph), is monitored for some short period of time after the driver applies the brakes. The following table relates the speed of the car to the amount of time, measured in seconds (sec), elapsed from the moment that the brakes are applied.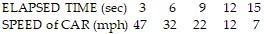 Represent the data in the table graphically with elapsed time on the horizontal axis and speed on the vertical axis. What general trend do the data reflect?
A. There is no apparent trend in the data.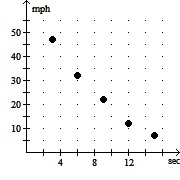
B. With increasing elapsed time,
the speed decreases.
C. With increasing elapsed time,
the speed increases.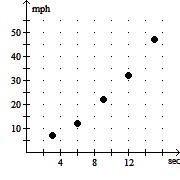
D. With increasing elapsed time,
the speed increases.
Answer: B
Mathematics
You might also like to view...
Find the perimeter (P) of each figure.
A. 94 cm B. 90 cm C. 47 cm D. not enough information given
Mathematics
Determine whether the graph is the graph of a function.
A. Yes B. No
Mathematics
Without using a calculator, determine the value of the trigonometric function or state that the value is undefined.tan 
A. -1
B. 
C. 1
D. 
Mathematics
Find the slope and the y-intercept of the line.x + y = 1
A. m = 1; b = -1 B. m = 0; b = -1 C. m = -1; b = 1 D. m = 1; b = 0
Mathematics