Use the data in the table to construct a line graph.The following table shows the median teacher's salary in District X over several years.Label the x-axis and y-axis for the time and the numerical value variables. 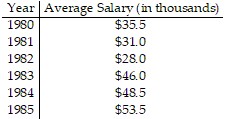
What will be an ideal response?
Answers may vary. One possible answer: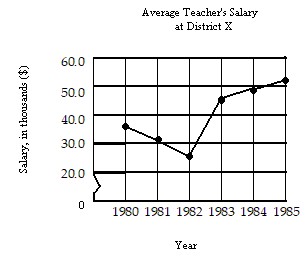
Mathematics
You might also like to view...
Find the first five terms of the recursively defined sequence.a1 = 9, an = an-1 + 6
A. 15, 21, 27, 33, 39 B. 9, 6, 12, 18, 24 C. 9, 15, 21, 27, 33 D. 0, 6, 12, 18, 24
Mathematics
Given f(x) and g(x), find the sum or difference as indicated.If f(x) =  and g(x) = x2
 , find f(x) + g(x).
A. 9x2
B. 9
C. 9x
D. 9x2
Mathematics
Convert to a logarithmic equation.5-2 = 
A. 5 = log 2 
B. -2 = log 5 
C.  = log 5 -2
D. -2 = log 1/25 5
Mathematics
Convert to radical notation and simplify.x2/11
A. x
B. 
C. 
D. 
Mathematics