Graph the numbers on a number line.-8, -6, -4, -2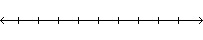
A. ![]()
B. ![]()
C. ![]()
D. ![]()
Answer: B
You might also like to view...
Write the number in standard notation.9.0519 x 10-7
A. -905190,000 B. 0.000000090519 C. 0.0000090519 D. 0.00000090519
Provide an appropriate response.The dot plot shows the number of tornadoes each year in a certain county during the period 1948 to 2004. Describe the range of the data, the "typical" value, and the most common number of tornadoes. Are there any outliers? 
A. The number of tornadoes per year ranges from 0 to 7. Most values lie between 4 and 5 with the most common number of tornadoes being 5. The value 7 is an outlier. B. The number of tornadoes per year ranges from 0 to 7. Most values lie between 4 and 6 with the most common number of tornadoes being 5. There are no outliers. C. The number of tornadoes per year ranges from 1 to 7. Most values lie between 4 and 6 with the most common number of tornadoes being 5. There are no outliers. D. The number of tornadoes per year ranges from 0 to 7. Most values lie between 4 and 6 with the most common number of tornadoes being 5. The values 0 and 7 are outliers.
Sketch the line with the given slope that passes through the indicated point.Slope is undefined; line passes through the point (10, -6)
A. 
B. 
C. 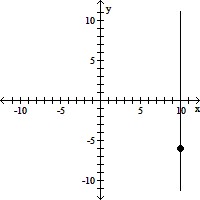
D. 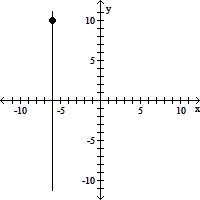
Divide, if possible.
A. 0
B. 
C. 
D. Undefined