By graphing the function, visually estimate its domain and range.t(x) = 
A. Domain: (-?, ?); range: (-?, ?)
B. Domain: (-?, 3]; range: [0, ?)
C. Domain: [3, ?); range: [3, ?)
D. Domain: (-?, 3]; range: (-?, 3]
Answer: B
You might also like to view...
Solve the problem.In most societies, men say they prefer women who are younger. In country A, the preferred age in a mate for men is 16 years younger than self. In country B, the preferred age in a mate for men is 8
 years younger than self. What is the difference between the preferred age in a mate for men in country A and men in country B?
A. 24 yr
yr
B. 7 yr
yr
C. 23 yr
yr
D. 7 yr
yr
Graph the ellipse. +
+  = 1
= 1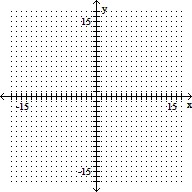
A. 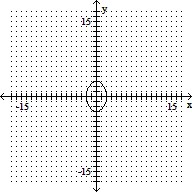
B. 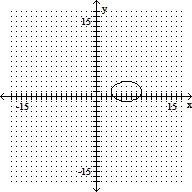
C. 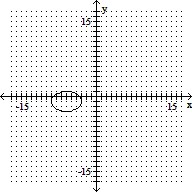
D. 
Expand.(x3 - 2y2)5
A. x15 - 2x12y2 + 4x9y4 - 8x6y6 + 16x3y8 - 32y10 B. x15 - 10x7y2 + 40x6y4 - 80x5y5 + 80x3y6 - 32y7 C. x15 - 10x12y2 + 40x9y4 - 80x6y6 + 80x3y8 - 32y10 D. x15 - 32y10
Classify the polynomial as constant, linear, quadratic, cubic, or quartic, and determine the leading term, the leading coefficient, and the degree of the polynomial.f(x) = 6x2 - 11 + 0.14x - 8x3
A. Constant; -11; -11; 1 B. Cubic; x3; -8; 3 C. Quadratic; 6x2; 6; 2 D. Cubic; -8x3; -8; 3