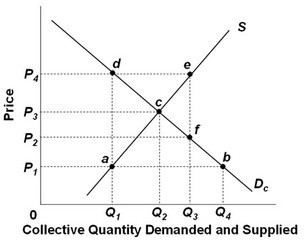
 Refer to the above supply and demand graph for a public good. Line segment ad represents the amount at Q1 by which the:
A. marginal benefit of this public good is greater than the marginal cost.
B. total benefit of this public good is greater than the total cost.
C. marginal benefit of this public good is less than the marginal cost.
D. total benefit of this public good is less than the total cost.
Answer: A
You might also like to view...
Empirical evidence across numerous countries indicates that changes in the ________ are associated with nearly equiproportional changes in ________
A) money supply, real GDP per year B) money supply, price level C) price level, money supply D) real GDP per year, income velocity of money
Rising unemployment and decreased business confidence could be signs that the economy is at the start of a(n):
A. recession. B. boom. C. recovery. D. expansion.
Suppose that at the current level of output, price = $100, MC = $100, AVC = $80, and ATC = $90. Which of the following is TRUE?
A) The firm should decrease output. B) The firm should shut down. C) The firm should increase output. D) The firm should maintain the current level of output.
Foreign currency exchanges and interest payments on foreign debt are examples of:
A. financial flows. B. trade flows. C. capital flows. D. technology flows.