Solve the problem.The graph below shows the rate of change of the price of a stock (in dollars per share per week) over a period of 6 weeks. Estimate the total change in dollars per share of the stock during this period. Use rectangles with widths of 1 week, and let the function value at the midpoint of the rectangle give the height of the rectangle.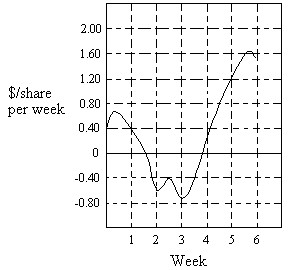
A. $2.20/share
B. $2.00/share
C. $0.90/share
D. $1.60/share
Answer: A
Mathematics
You might also like to view...
Use the Venn diagram shown to list the set in roster form.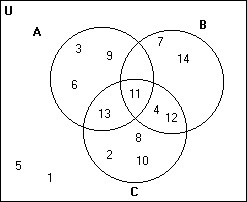 (A ? B)'
A. {1, 2, 3, 4, 5, 6, 7, 8, 9, 10, 11, 12, 13, 14} B. {1, 2, 5, 8, 10} C. {2, 5, 8, 10, 11, 12} D. {3, 4, 6, 7, 9, 11, 12, 13, 14}
Mathematics
Simplify using scientific notation. Leave your answer in scientific notation.9003
A. 3 × 10⁷ B. 7.3 × 10⁷ C. 7.3 × 10⁴ D. 7.3 × 10⁸
Mathematics
Simplify the expression by using the order of operations.92 + 62
A. 30 B. 117 C. 225 D. 60
Mathematics
State the real number that corresponds to the situation.In one state, the highest point is 3643 feet above sea level.
A. -3643 B. 3643
Mathematics