Provide an appropriate response.Solve using a system of equations with two unknowns:Pat Miller invested $8,000, part of it at 4% simple annual interest and part of it at 3% simple annual interest. If the total income for one year was $288, how much was invested at 4%?
A. $3,600
B. $4,800
C. $3,200
D. $4,000
Answer: B
Mathematics
You might also like to view...
Graph the parabola.y = -3x2
A. 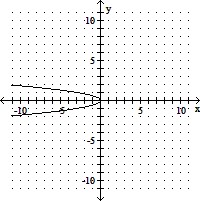
B. 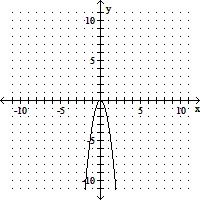
C. 
D. 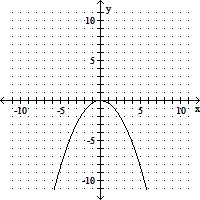
Mathematics
Find the common difference of the arithmetic sequence. ,
,  ,
,  ,
,  , ...
, ...
A. 4 B. 5 C. 2 D. - 2
Mathematics
Evaluate.4 ? 32
A. 16 B. 13 C. 36 D. 12
Mathematics
Use a graphing calculator to plot the data and find the quadratic function of best fit.The following table shows the median number of hours of leisure time that Americans had each week in various years. Use x = 0 to represent the year 1973. Using a graphing utility, determine the quadratic regression equation for the data given. What year corresponds to the time when Americans had the least time to spend on leisure?
What will be an ideal response?
Mathematics