Assume that the data shown in Table 4.2 were collected on a rural road in your state and consideration is being made to set the speed limit on the road. Speed limits of 50, 55, 60, and 65 mi/h are being considered. Plot the expected non-compliance percentages vs. the associated speed limit on a graph and recommend the speed for the road. Give reasons for your selection.
What will be an ideal response?
Examination of the data in Table 4.2 shows that the number of observations
exceeding 50, 55, 60, and 65 mi/h are 38, 17, 5, and zero, respectively. In
percentages, these are 44.2%, 19.7%, 5.8%, and 0%, respectively. The plot
appears below.
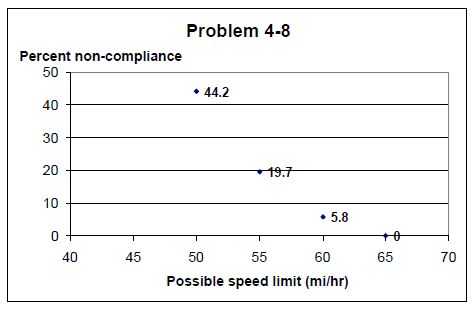
The 85th percentile speed, speed above which 15 percent of vehicles travel, is
usually recommended for the road. Therefore, 55 mi/h will be recommended
as the speed for the road, as 19.7% of vehicles travel above it.
You might also like to view...
What is the first drawing of a set of plans describing a building often called?
a. overview b. introductory page c. cover page d. title page
Less than 0.5 percent of Earth's water is in the form of groundwater
Indicate whether the statement is true or false
The temperature difference between the inlet and outlet of the condenser should be _________________
A) Equal B) 10°F to 30°F C) 20°F to 50°F D) Greater than 60°
____________________ should be worn when handling fluids that could burn your eyes.
Fill in the blank(s) with the appropriate word(s).