A biology class performs an experiment comparing the quantity of food consumed by a certain kind of moth with the quantity supplied. The model for the experimental data is given by
?
?
?
where x is the quantity (in milligrams) of food supplied and y is the quantity (in milligrams) of food consumed.
Select the correct graph of this model.
?
A. ?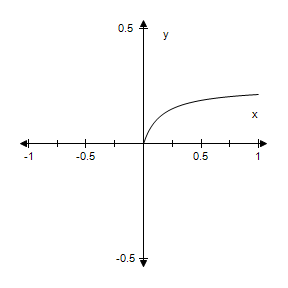
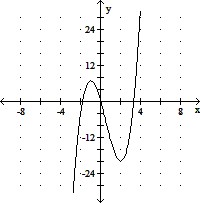
B. ?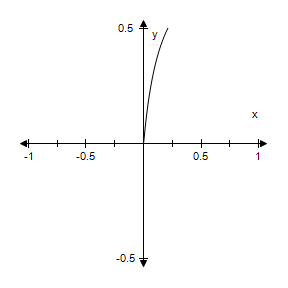
C. ?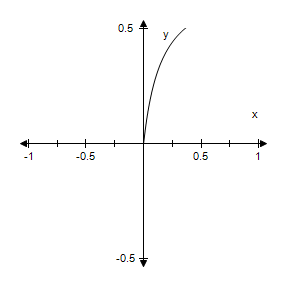
D. ?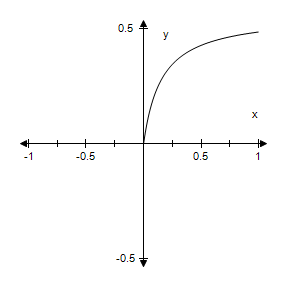
E. ? 
Answer: A
You might also like to view...
Graph the equation. Include the coordinates of any local extreme points and inflection points.y = 2x3 - 3x2 - 12x
A. local minimum: (-2, 8)
local maximum: (0, 0)
inflection point: (-1, 4)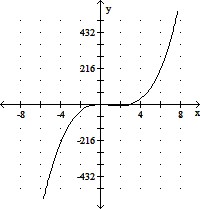
B. no extrema
inflection point: (0, 0)
C. local minimum: (2, -20)
local maximum: (-1, 7)
inflection point: 
D. local minimum: (3, -30)
no inflection point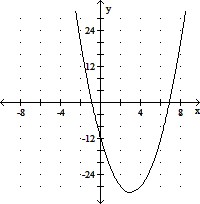
Describe the situation with a linear inequality and then solve the inequality.Every Sunday, Jarod buys a loaf of fresh bread for his family from the corner bakery for $4.00. The local department store has a sale on breadmakers for $73. If the bread-making supplies cost $0.67 per week, for how many weeks would Jarod have to bake a loaf of bread at home before the breadmaker becomes more cost effective?
A. at least 22 weeks B. at least 21 weeks C. at least 23 weeks D. at least 24 weeks
Consider the points plotted in the graph below.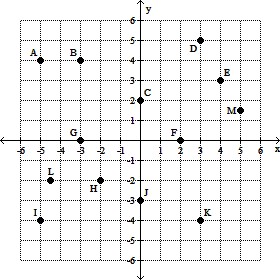 Give the coordinates for points C and D.
A. C: (0, 2), D: (3, 5) B. C: (2, 0), D: (5, 3) C. C: (2, 0), D: (3, 5) D. C: (0, 2), D: (5, 3)
Replace the ? with < or >.649.4403 ? 649.4304
A. = B. < C. >