Solve the problem.The one-day temperatures for 12 world cities along with their latitudes are shown in the table below. Make a scatter diagram for the data. Then find the line of best fit and graph it on the scatter diagram. Latitude (degrees)
 Temperature (F)°
What will be an ideal response?
Latitude (degrees)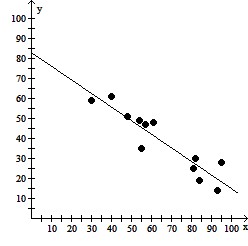
Temperature (F)°
Line of best fit = -0.68x + 82.91
Mathematics
You might also like to view...
Rationalize the denominator. Assume that all radicands represent positive real numbers.
A. 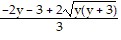
B. 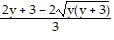
C. 
D. 
Mathematics
Simplify the rational expression. (Assume the denominator is nonzero.)
A. x - 7
B. 
C. 
D. 
Mathematics
Find the vertex.f(x) = x2 - 2
A. (0, 2) B. (2, 0) C. (-2, 0) D. (0, -2)
Mathematics
Solve.3x - 5 = 35 - 5x
A. - 20 B. - 15 C. 5 D. -5
Mathematics