The circular flow diagram shows that
A) households spend all their income on goods and services.
B) the value of total income is equal to the total value of expenditures on final goods and services.
C) firms pay households wages, and households receive transfer payments from firms.
D) GDP will be less than the total value of expenditures on final goods and services in the economy.
B
You might also like to view...
Refer to the graphs shown. Assume the graph reflects demand in the automobile market. Which arrow best captures the impact of increased gasoline prices on the automobile market?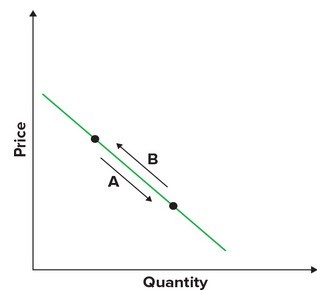
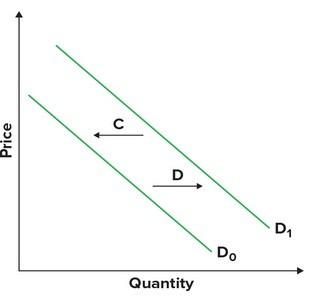
A. A B. B C. C D. D
As you move down the production possibility frontier, the absolute value of the marginal rate of transformation
A. increases. B. initially decreases, then increases. C. decreases. D. initially increases, then decreases.
If the dollar price of one yen is $.04, a Japanese good priced at 560 yen would cost an American:
A. $22.40. B. $2,240. C. $14,000. D. $2.40.
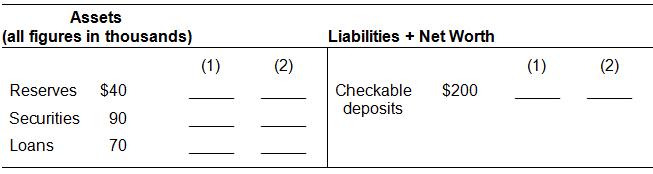
Assume that households and businesses deposit $5000 in this bank and that this currency is added to the bank’s reserves. In column (1) show the bank’s balance sheet after this occurs. Is there a change in the money supply? In column (2) show what would happen if the bank now loans all of its excess reserves to a depositor. Is there a change in the money supply?
Suppose the First National Bank has the following simplified balance sheet. The reserve ratio is 20%.