According to the graph shown, if the economy were operating under free trade and then imposed a tariff, the overall impact on surplus would be a net:
This graph demonstrates the domestic demand and supply for a good, as well as a tariff and the world price for that good.
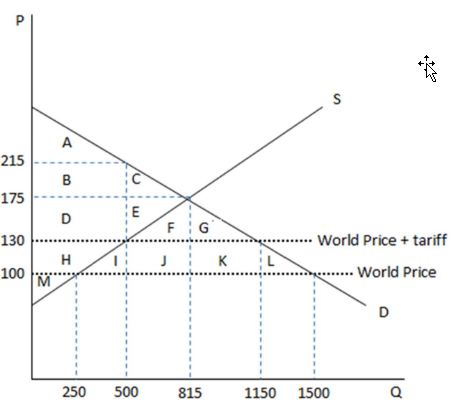
A. gain of IJKL.
B. loss of IJKL.
C. loss of IL.
D. gain of FGHIJKL.
C. loss of IL.
You might also like to view...
Using the rule of 70, if the GDP per capita growth rate in the United States is 4.4 percent, real GDP per capita doubles every
A) 6.72 years. B) 15.91 years. C) 44 years. D) 65.6 years.
According to the law of demand, consumers will
A) change their production plans when the price of a good changes. B) change their consumption plans when the price of a good changes. C) change their demand when the price of a good changes. D) increase their quantity demanded when the price of a good increases. E) decrease their quantity demanded when the price of a good decreases.
The marginal rate of substitution is
A. the slope of the utility curve. B. the slope of the contract curve. C. the slope of the utility possibilities curve. D. none of these answer options are correct.
Before about 1975
a. any federal deficits were at least 5 percent of GDP. b. most federal deficits were less than 2 percent of GDP. c. the federal government never ran deficits. d. the federal government always ran a surplus. e. any federal deficits were at least 7 percent of GDP.