The stack plot below shows the value of each of Danny's investments. The stack plot contains three regions. The uppermost unshaded region represents the value of Danny's investment in individual stocks. The center shaded region represents the value of Danny's investment in mutual funds and the bottom region in black represents the value of Danny's investment in a CD. The thickness of a region at a particular time tells you its value at that time. 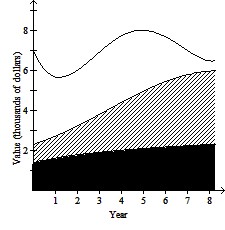 Use the graph to answer the question.In year 8, what was the approximate value of Danny's investment in mutual funds?
A. $2500
B. $1900
C. $4000
D. $6000
Answer: C
You might also like to view...
Change the order of integration and evaluate the integral.
A.  ?
?
B. 265?
C.  ?
?
D.  ?
?
Solve the problem by using addition, subtraction, multiplication, or division as needed.Raisa's car used 16 gallons of gasoline when she drove it 224 miles. How many miles per gallon did it get?
A. 16 miles per gallon B. 14 miles per gallon C. 208 miles per gallon D. 23 miles per gallon
Rotate the axes so that the new equation contains no xy-term. Discuss the new equation.x2 + 2xy + y2 - 8x + 8y = 0
A. ? = 36.9° +
+  = 1
= 1
ellipse
center (0, 0)
major axis is x'-axis
vertices at (±2, 0)
B. ? = 36.9° +
+  = 1
= 1
ellipse
center (0, 0)
major axis is x'-axis
vertices at (±2, 0)
C. ? = 45°
x'2 = -4 y'
y'
parabola
vertex at (0, 0)
focus at (0, - )
)
D. ? = 45°
y'2 = -4 x'
x'
parabola
vertex at (0, 0)
focus at (- , 0)
, 0)
Solve the problem.You invested $34,200 and started a business selling vases. Supplies cost $10 per vase and you are selling each vase for $29. Determine the number of vases, x, that must be produced and sold to break even.
A. 1800 units B. 713 units C. 1801 units D. 1802 units