Which of these statistics BEST describes the relationship in this scatterplot?
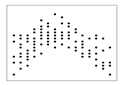
a. r = .00
b. r = .50
c. r = –.50
d. r = 1.00
a. r = .00
You might also like to view...
People with a high need to achieve are not likely to do well on a task where:
a) they run the risk of losing or failing. b) they must devote a great amount of time. c) there is no challenge. d) no money is offered as a reward.
Which of the following is a developmental landmark of early childhood?
A. having all primary teeth erupted B. experiencing a high degree of egocentrism in thought processes C. learning quickly D. all of the above are correct E. the second and third choices only
On IQ tests with a mean of 100 and a standard deviation of 15 (e.g. The Wechsler Scales)which of the following scores would be in the High Average range
a. 75 b. 85 c. 105 d. 115
Analyse the cycling time-trial data below. Thirty-two elite cyclists were randomly allocated into one of four groups. Without using SPSS, calculate the mean and total for each group. The groups were as follows
Received caffeine and were told it wasReceived caffeine and were told it was notReceived no caffeine and were told it was notReceived no caffeine but were told it was ID Group Distance (km) 1 Received caffeine and told correctly 50 2 Received caffeine and told correctly 40 3 Received caffeine and told correctly 46 4 Received caffeine and told correctly 44 5 Received caffeine and told correctly 47 6 Received caffeine and told correctly 45 7 Received caffeine and told correctly 48 8 Received caffeine and told correctly 47 9 Received caffeine but told it was not 37 10 Received caffeine but told it was not 41 11 Received caffeine but told it was not 45 12 Received caffeine but told it was not 42 13 Received caffeine but told it was not 37 14 Received caffeine but told it was not 41 15 Received caffeine but told it was not 40 16 Received caffeine but told it was not 36 17 Did not receive caffeine and told correctly 40 18 Did not receive caffeine and told correctly 38 19 Did not receive caffeine and told correctly 36 20 Did not receive caffeine and told correctly 39 21 Did not receive caffeine and told correctly 38 22 Did not receive caffeine and told correctly 35 23 Did not receive caffeine and told correctly 35 24 Did not receive caffeine and told correctly 50 25 Did not receive caffeine but told it was 47 26 Did not receive caffeine but told it was 47 27 Did not receive caffeine but told it was 41 28 Did not receive caffeine but told it was 50 29 Did not receive caffeine but told it was 43 30 Did not receive caffeine but told it was 50 31 Did not receive caffeine but told it was 50 32 Did not receive caffeine but told it was 46 Group 1- Mean: 45.9 kmTotal:367 km Group 2 Mean:39.9 kmTotal:319 km Group 3 Mean:38.9 kmTotal:311 km Group 4 Mean:46.8 kmTotal:374 kmHow would you calculate the total sum of squares? A. SST = SSW + SSB B. SST = SSW – SSB C. SST = SSB / SSW D. SST = SSB × SSW