For each data set shown by the table, a. Create a scatter plot for the data.b. Use the scatter plot to determine whether an exponential function, a logarithmic function, or a linear function is the best choice for modeling the data.Number of Homes Built in a Town by Month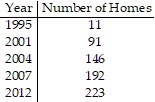
What will be an ideal response?
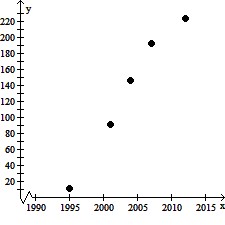
Exponential function
You might also like to view...
Use the general multiplication rule to find the indicated probability.In January in a certain city the unconditional probability of rain on any given day of the month is 0.400. But the probability of rain on a day that follows a rainy day is 0.600 and the probability of rain on a day following a nonrainy day is 0.250. Find the probability that January 1st and January 2nd are rainy and that January 3rd and 4th are not rainy given that December 31st was clear all day.
A. 0.072 B. 0.045 C. 0.024 D. 0.038
Solve.The population growth of an animal species is described by  where t is measured in months. Find the population of this species in an area 40 month(s) after the species is introduced.
A. 4950 B. 1100 C. 2495 D. 560
Write the reference angle for the given angle.373°
A. 77° B. 13° C. 167° D. 103°
Find the exact value of the following expression without using a calculator.sin 30°
A. 
B. 
C. 
D. 