Run and discuss the univariate and descriptive statistics of the clinton variable.
Using the 2016 ANES, replicate the analysis with feelings towards Trump using feelings towards Hillary Clinton. The variable for Clinton is V161086 and use the same 8 predictor variables.
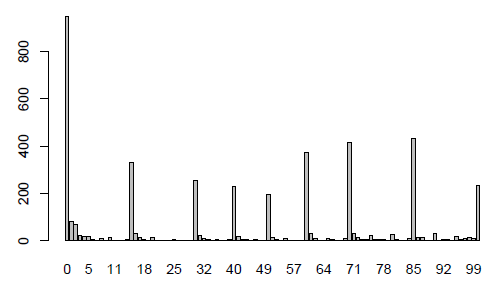
Feelings Towards Clinton:
library(descr)


freq(ordered(nes$clinton))
ordered(nes$clinton)
Frequency Percent Valid Percent Cum Percent
0 947 22.17279 22.37184 22.37
1 81 1.89651 1.91354 24.29
2 69 1.61555 1.63005 25.92
3 24 0.56193 0.56697 26.48
4 17 0.39803 0.40161 26.88
5 20 0.46827 0.47248 27.36
6 4 0.09365 0.09450 27.45
7 1 0.02341 0.02362 27.47
8 9 0.21072 0.21262 27.69
9 2 0.04683 0.04725 27.73
10 16 0.37462 0.37798 28.11
11 2 0.04683 0.04725 28.16
12 2 0.04683 0.04725 28.21
13 1 0.02341 0.02362 28.23
14 4 0.09365 0.09450 28.33
15 332 7.77336 7.84314 36.17
16 33 0.77265 0.77959 36.95
17 14 0.32779 0.33073 37.28
18 6 0.14048 0.14174 37.42
19 2 0.04683 0.04725 37.47
20 16 0.37462 0.37798 37.85
21 1 0.02341 0.02362 37.87
22 1 0.02341 0.02362 37.89
23 2 0.04683 0.04725 37.94
24 2 0.04683 0.04725 37.99
25 5 0.11707 0.11812 38.11
26 1 0.02341 0.02362 38.13
27 3 0.07024 0.07087 38.20
28 3 0.07024 0.07087 38.27
29 3 0.07024 0.07087 38.34
30 257 6.01733 6.07134 44.41
31 24 0.56193 0.56697 44.98
32 10 0.23414 0.23624 45.22
33 7 0.16390 0.16537 45.38
34 1 0.02341 0.02362 45.41
35 6 0.14048 0.14174 45.55
36 3 0.07024 0.07087 45.62
38 1 0.02341 0.02362 45.64
39 6 0.14048 0.14174 45.78
40 228 5.33833 5.38625 51.17
41 20 0.46827 0.47248 51.64
42 6 0.14048 0.14174 51.78
43 4 0.09365 0.09450 51.88
44 2 0.04683 0.04725 51.93
45 6 0.14048 0.14174 52.07
46 1 0.02341 0.02362 52.09
49 2 0.04683 0.04725 52.14
50 195 4.56568 4.60666 56.74
51 15 0.35121 0.35436 57.10
52 4 0.09365 0.09450 57.19
53 2 0.04683 0.04725 57.24
55 8 0.18731 0.18899 57.43
56 1 0.02341 0.02362 57.45
57 2 0.04683 0.04725 57.50
58 1 0.02341 0.02362 57.52
59 1 0.02341 0.02362 57.55
60 373 8.73332 8.81172 66.36
61 33 0.77265 0.77959 67.14
62 10 0.23414 0.23624 67.38
63 3 0.07024 0.07087 67.45
64 3 0.07024 0.07087 67.52
65 10 0.23414 0.23624 67.75
66 5 0.11707 0.11812 67.87
67 2 0.04683 0.04725 67.92
68 1 0.02341 0.02362 67.94
69 10 0.23414 0.23624 68.18
70 414 9.69328 9.78030 77.96
71 31 0.72583 0.73234 78.69
72 13 0.30438 0.30711 79.00
73 4 0.09365 0.09450 79.09
74 4 0.09365 0.09450 79.19
75 22 0.51510 0.51973 79.71
76 6 0.14048 0.14174 79.85
77 4 0.09365 0.09450 79.94
78 5 0.11707 0.11812 80.06
79 3 0.07024 0.07087 80.13
80 25 0.58534 0.59060 80.72
81 4 0.09365 0.09450 80.82
82 3 0.07024 0.07087 80.89
83 1 0.02341 0.02362 80.91
84 11 0.25755 0.25986 81.17
85 434 10.16155 10.25278 91.42
86 13 0.30438 0.30711 91.73
87 13 0.30438 0.30711 92.04
88 3 0.07024 0.07087 92.11
89 3 0.07024 0.07087 92.18
90 33 0.77265 0.77959 92.96
91 3 0.07024 0.07087 93.03
92 4 0.09365 0.09450 93.13
93 4 0.09365 0.09450 93.22
94 1 0.02341 0.02362 93.24
95 18 0.42145 0.42523 93.67
96 4 0.09365 0.09450 93.76
97 8 0.18731 0.18899 93.95
98 13 0.30438 0.30711 94.26
99 11 0.25755 0.25986 94.52
100 232 5.43198 5.48075 100.00
NA's 38 0.88972
Total 4271 100.00000 100.00000
We see that the mode is 0 for feelings towards Clinton.
median(nes$clinton,na.rm=TRUE)


[1] 40


mean(nes$clinton,na.rm=TRUE)


[1] 42.15143


sd(nes$clinton,na.rm=TRUE)


[1] 34.22733
We see that the median is 40 and mean is 42.15. Based on those numbers only, we would conclude that respondents feel somewhat cool to neutral towards Clinton, but the standard deviation provides a better understanding. At 34.23, the standard deviation tells us there is a large spread of responses from the mean - that respondents are not clustered at the median or mean.
What can we conclude about feelings toward Clinton based on these descriptive statistics? While on the whole there are more respondents that feel cool than warm towards Clinton it is not overwhelmingly the case;
roughly 43% of respondents have feelings above the neutral cut-point of 50. Compared to Trump, respondents have slightly warmer feelings towards Clinton.
You might also like to view...
Reagan combined the unemployment rate with the inflation rate and called it the
a) Poor index b) Misery index c) Depression index d) Recession index
Disabilities can be grouped as
a) social and political b) economic or work c) activity limitation and causative condition d) all of the above
Answer the following statement(s) true (T) or false (F)
. If you have sample selection bias in your sampling procedures, you can generalize your findings on a scientific basis.
When forming a proposal for a group, which of the five general guideline areas would you ask yourself the question: does your proposal contain strategies for evaluating how well the stated objectives were met?
A) ?Rationale B) ?Objectives C) ?Procedures D) ?Evaluation