Figure 11-2
?
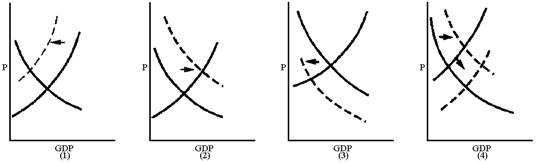
Which graph in Figure 11-2 best reflects a Keynesian’s view of the impact of raising taxes on saving?
A. 1
B. 2
C. 3
D. 4
Answer: B
You might also like to view...
According to the Bureau of Labor Statistics, the time spent working on days worked is
A) longer for men than it is for women. B) longer for women than it is for men. C) roughly equal for all men and women. D) roughly equal for men and women closer to age 45, but longer for women closer to retirement age than for men closer to retirement age.
Suppose a monopsonist hires its second worker and this hiring has a marginal factor cost of $75 per day. If the market wage is now $62.50 per day, what was the first employee earning when she worked alone?
a. $40. b. $45. c. $50. d. $55. e. $60.
A country that typically runs a trade surplus is:
A. the United States. B. China. C. France. D. Canada.
Ninety percent of spending on education happens at the ______________ level.
a. federal b. federal and state c. state d. state and local