Use the graph of the given one-to-one function to sketch the graph of the inverse function. For convenience, the graph of y = x is also given.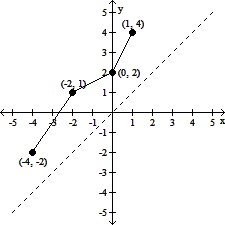
A. 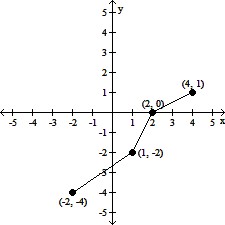
B. 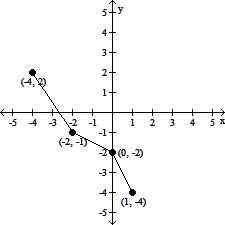
C. 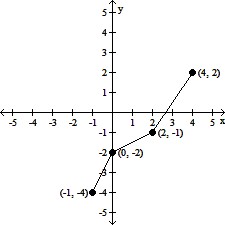
D. 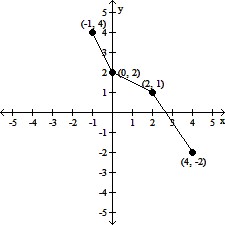
Answer: A
You might also like to view...
Provide an appropriate response.The given table represents a function. Identify the independent and dependent variables, and describe the domain and range.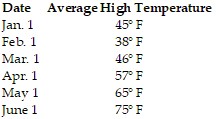
A. The variables are (time, temperature) or (date, temperature). The domain is all days over the course of a year. The range is temperatures between 45° and 
B. The variables are (temperature, time) or (temperature, date). The domain is all temperatures between 45° and 41° and the range is all days over the course of a year.
C. The variables are (temperature, time) or (temperature, date). The domain is all temperatures between 38° and 89° and the range is all days over the course of a year.
D. The variables are (time, temperature) or (date, temperature). The domain is all days over the course of a year. The range is temperatures between 38° and 89°.
Solve the inequality. Describe the solution with a graph.-20x - 28 ? -4(4x + 3)![]()
A. ![]()
B. ![]()
C. ![]()
D. ![]()
Rotate the figure about the point as indicated.Rotate the figure 180° about point A.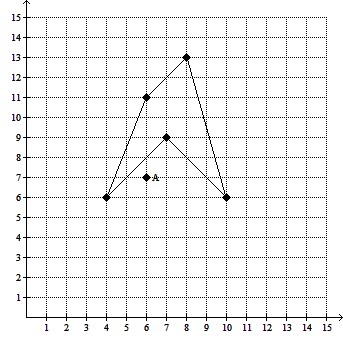
What will be an ideal response?
Use formulas to find the area of the plane region.
A. 226.87 mi2 B. 907.46 mi2 C. 53.38 mi2 D. 106.76 mi2