Solve the problem.You brake your car from a speed of 65 mph. The table shows data that represent your car's speed versus the amount of time elapsed from the moment that you began to brake.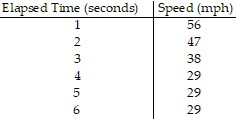 Graph the data. What is the slope of the line segment that represents the period of time during which the speed decreases?
A. 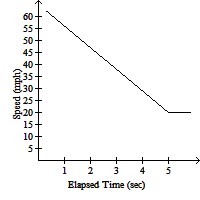
The slope of the decrease is -9.
B. 
The slope of the decrease is -10.
C. 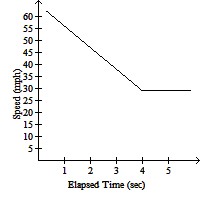
The slope of the decrease is 9.
D. 
The slope of the decrease is -9.
Answer: D
Mathematics
You might also like to view...
Find the sum.
A. 55 B. 52 C. 5 D. 21
Mathematics
The function f is one-to-one. Find its inverse.f(x) = 
A. f-1(x) = 
B. f-1(x) = 
C. f-1(x) = 4x
D. f-1(x) = -4x
Mathematics
Provide an appropriate response.Identify whether the slope is positive, negative, zero, or undefined.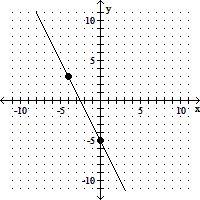
A. Negative B. Zero C. Positive D. Undefined
Mathematics
Add the numbers.3 + 2
A. 5 B. 4 C. 3 D. 2
Mathematics