The following graph shows the monthly sales for Big "D" Sales during 2000 and 2001. Use the graph to solve the problem.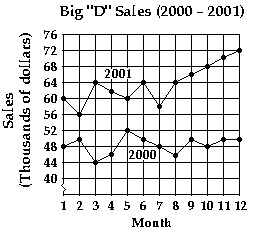 What was the increase in sales between month 5 and month 6 of 2001?
A. $4000
B. $800
C. $4
D. $8000
Answer: A
Mathematics
You might also like to view...
Find all solutions in [0, 2?) for the equation.2 cos -
-  = 0
= 0
A. 
B. 
C. 
D. 
Mathematics
Let A = {q, s, u, v, w, x, y, z}, B = {q, s, y, z},  and
and  Specify the following set.B ? C
A. {q, s, w, y, z} B. {q, y, z} C. {y, z} D. {q, w, y}
Mathematics
Solve.A town has a population of 3000 people and is increasing by 9% every year. What will the population be at the end of 8 years?
A. 5160 people B. 5978 people C. 5484 people D. 6516 people
Mathematics
Provide an appropriate response.A job pays a salary of $29,000 for the first year. with an annual increase of 4% per year beginning in the second year. What is the total salary paid over an 9-year period? (Round to the nearest cent.)
A. $39,688.50 B. $267,212.56 C. $306,901.06 D. $348,177.11
Mathematics