Each point along the market demand curve shows
a. the quantity of the good that firms would be willing and able to supply at a specific price
b. the relationship between the price of the good and total quantity demanded at a series of prices
c. the opportunity cost of supplying a given quantity of goods to the market
d. the quantity of the good that consumers would be willing and able to purchase at a specific price
e. how population changes affect the quantity demanded at a specific price
D
You might also like to view...
Free riding:
A. cannot occur if strategizing takes place. B. is reflected by a downward-sloping best response function. C. is reflected by an upward-sloping best response function. D. is no player's best response.
If a society's unemployment rate rises from 5 percent to 8 percent, the result will be a leftward shift of the society's PPF.
Indicate wheher the statement is true or false.
Consumer?producer rivalry occurs because of:
A. producers' high production cost and consumers' low valuation of a good. B. consumers' high valuation and producers' low production cost of a good. C. the competing interests of consumers and producers. D. None of the statements associated with this question are correct.
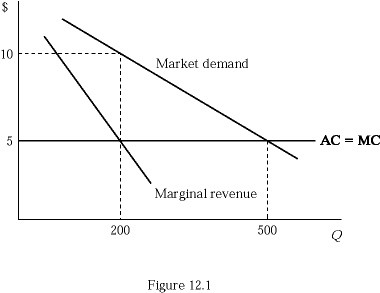 Figure 12.1 shows a successful price-fixing arrangement (cartel) between two identical firms. When the two firms act like one and charge the same price, each firm will earn an economic profit of ________.
A. $1,250 B. $1,000 C. $500 D. $0